Create Radar Chart
Create Radar Chart: This video contains how to create Radar Chart in OPNBI.
Click on the Hamburger icon.

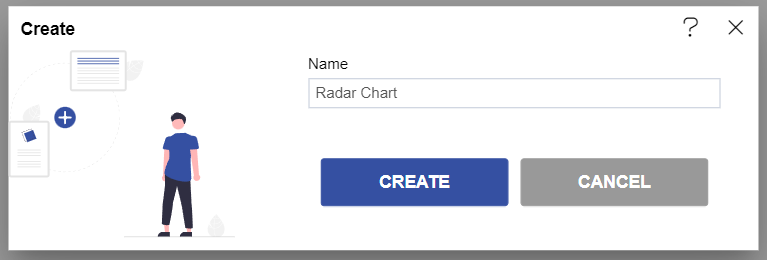
Create dashboard box will be shown on the screen. Users can create a dashboard by clicking on the + icon.

Users can set the dashboard name as per their requirements. Click on create button after entering the dashboard name in the dialog box. As shown in the below image.
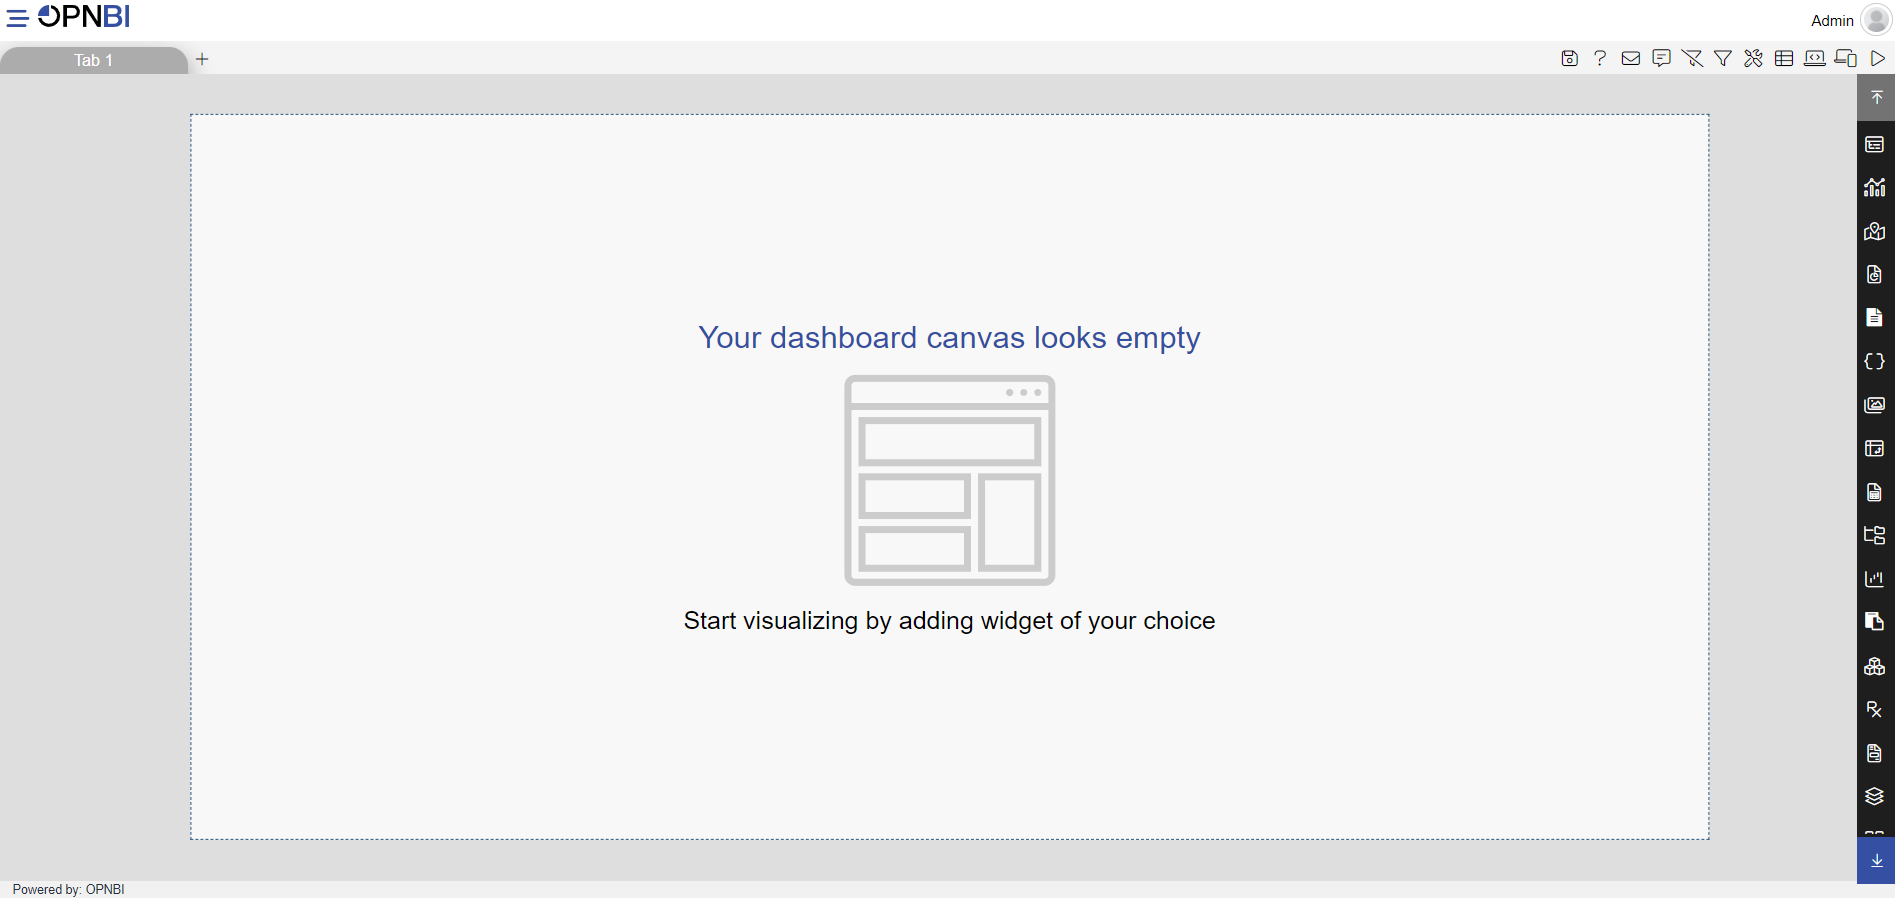
Users will see an empty Dashboard, as shown in the image below:
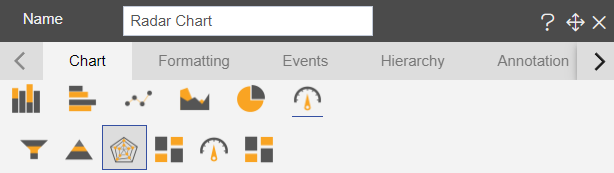
From the right vertical menu, select the Other Chart widget icon & select Radar Chart as shown in the image below:
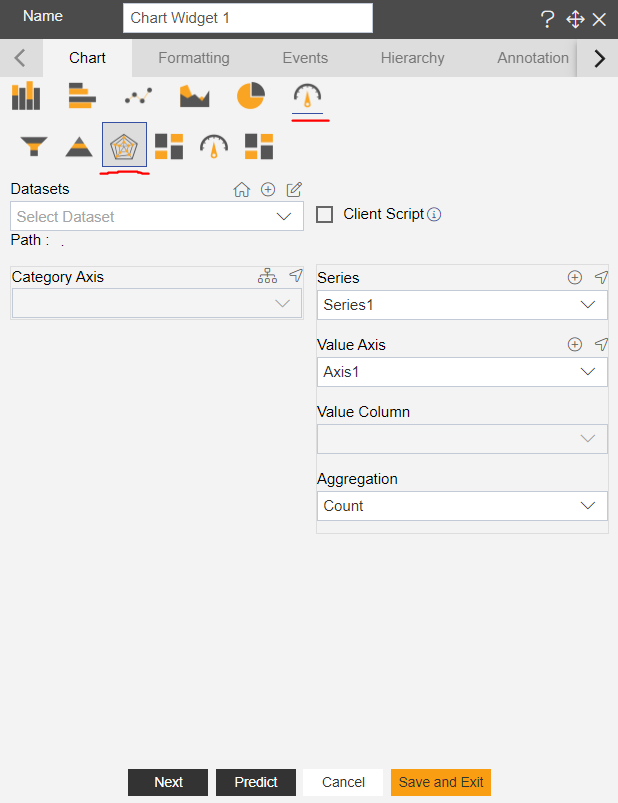
The edit menu will appear, and the widget gets added in the content place of the dashboard automatically.
Enter the widget name in the widget title box, as shown in the image below:
Enter the following details in the edit menu: • Dataset: sales • Category Axis: country • Value Column: productLine •
- Aggregation: Sum
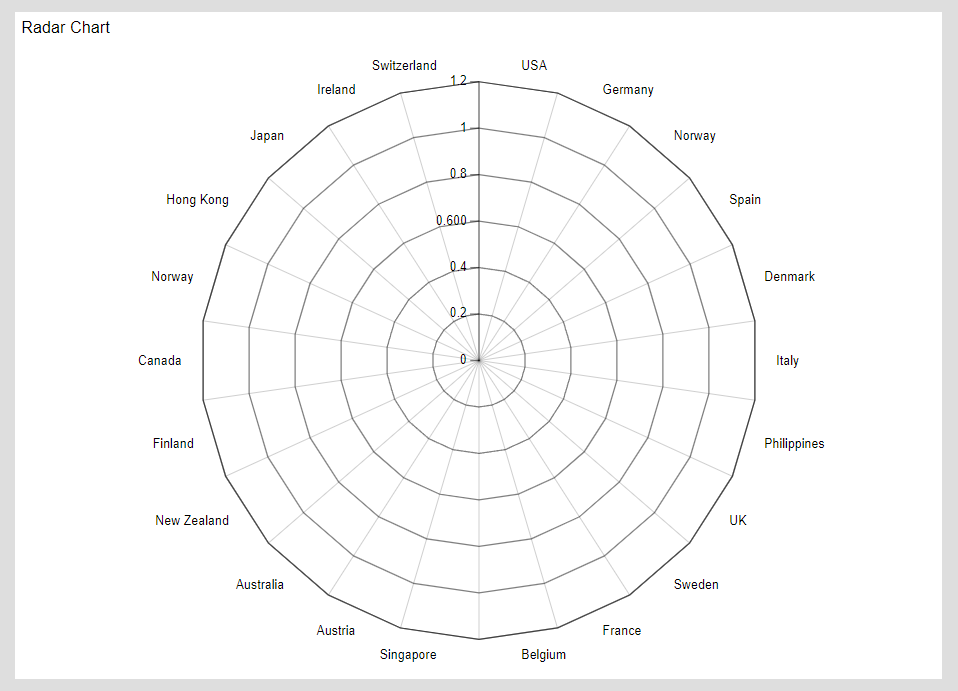
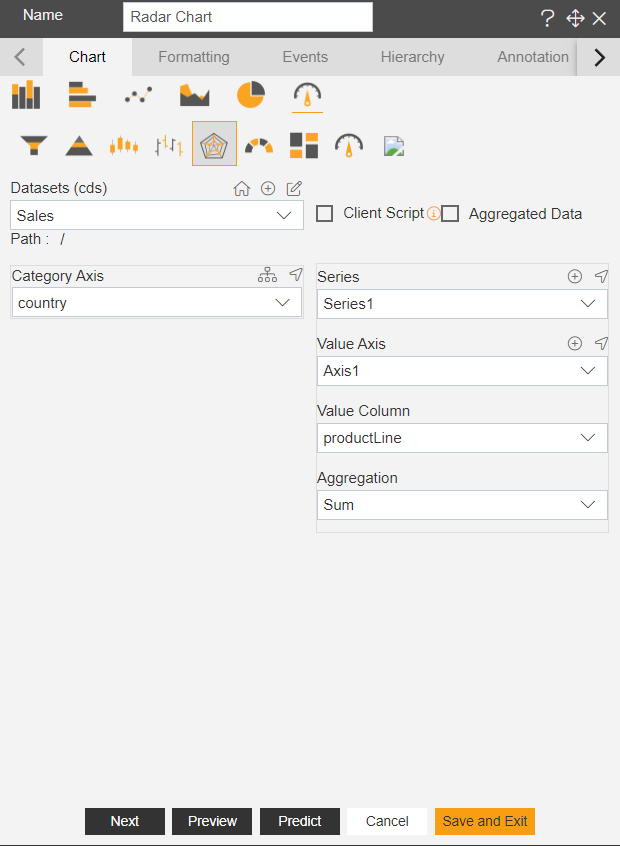Click on Preview & Save and Exit.
The chart will look as per the image below.
In order to understand in detail about other features, click on the following links:-